Showing posts with label BC. Show all posts

Wednesday, 14 April 2021

COVID False positives.


Source: BCCDC

I have often been forwarded articles like this one here which is stating the large probability of receiving a false negative on a COVID-19 test.

This, at first light, appears to be a huge problem.

From the article, we have the reported probability of receiving a false positive based on how many days you have had this disease for:

Day 1 of disease: 100% chance of false positive.

Day 4 of disease: 67% chance

After symptoms begin to show (When you would likely then go to get a test) 

Day 5 of disease 38%

Day 8 of disease 20% 

As I said, this appears to be frightening. Of those getting the test (who have symptoms) something close to 2 out of 5 tests will say that the person is COVID negative when in fact they have the disease.  

So let's work through this. Let's say that you are sick (or someone in your family is sick) and you decide to get a COVID test. You go through the process, get your brain tickled, then get the phone call later that evening. Good News. The result is negative. 

But then you read this article. Are you actually COVID free? or did you just receive a false negative? What is the likelihood that you actually have COVID given that you received a negative test result?

Well, we can actually work this out quite easily. 

Let's first utilize our general multiplication rule for events that are not mutually exclusive:

This says that the probability that both events A and B occur is the probability of A occurring multiplied by the probability of event B occurring, given that, A has already occured. To put this into a more straight forward sense:

Let suppose you have a cooler of beverages. 3 colas and 4 rootbeers. The probability you reach in (without looking) and pull out a cola and a rootbeer is a probability you pull out a cola and then the probability you pull out a rootbeer, given that, you have already pulled out a cola.  

Now the important piece to remember is that this goes both ways.

The probability, P(Cola and Rootbeer) is identical to the opposite P(Rootbeer and Cola). that is, the order is not necessarily important, as long as we finish with one of each. 

Thus we have that:

Why is this helpful to us? 

Almost there - let's open this up, define (A) and (B), and then things should start to become clear.

Where if we set: (A) = "Covid" or (C) and (B) = "Negative test" or (N) we obtain:

From here we can work through what we know (or can find out) in order to answer our question.

What was our question again? 
What is the likelihood that you actually have COVID given that you received a negative test result?

Right, that is, we are looking for P(C|N) so we need to determine values for all the other variables:
  • P(C)
  • P(N)
  • P(N|C)

So how do we go about solving all this?

Well, let's start out with P(C). Currently, there are just over 100k active cases in BC. Given a population of just over 5 million that puts you at about a 2.5% chance of having COVID.  Yes, exposures, or area in which you live/work/play is going to impact this, but we don't have that, so let's keep it simple. 
 
Let's then take a look at P(N). in total, just over 2 million tests have been done in BC (2 336 090), with just over 200K of those being a positive result (217 485) that is we can work out the P(+) to be 9.3%. Using our compliment rule, we can then obtain the P(N) to be 1-P(+) or 90.7%. 

Finally, we need to determine the P(N|C) That is, what is the probability you get a negative test result given that you have COVID. 

Hey, that is our false-negative rate as reported above. Let's start by using the 38% false negative. so summarizing all this we have:

  • P(C) = 0.025
  • P(N) = 0.907
  • P(N|C) = 0.38
We can then re-arrange our above formula to solve for P(C|N) and then make the appropriate substitutions.

Making our substitutions:


What does this mean? it means that given the low rates of actual COVID occurrence in the province and despite the relatively high rates of false negatives. the probability that you actually have COVID given that you received a False-negative is only 1%. That is reasonably low. 

What about if you had a test on day 4 (Pre-symptoms) which when you think about it, is extremely quick for you to realize - notified of an exposure (X) days ago, feeling fine, but will book a test just the same:
Again, despite the alarmingly high false-negative rate. the probability that you actually have COVID given that you received the negative test result is exceptionally low (less than 2%) 

Okay; so what is the moral of the story.

Articles like this come out - and they end up breeding fear and distrust of the tests - potentially leading to people not taking the tests at all. They may think the test is not worth it, the results are meaningless. This of course is problematic in determining caseloads, tracking spread, and combating and turning the tides for this disease. 

Despite these high rates of false negatives. This is still an extremely useful tool and an extremely valuable resource to utilize in our fight against COVID. 

Now - if infection rates were to skyrocket. suppose that instead there was an 80% chance that you had COVID. At that time we would have to question whether or not this test was effective, as the false-negative rate would be extremely problematic. But with our current "low" relative caseloads and infection rates, this large of a false-negative is not a huge concern. 


Thursday, 19 July 2018

Taxi Industry offers up "alternative" to Uber, Lyft

Source: https://www.videezy.com/free-video/taxi
Update: Later on the same day as writing this, the ministry of transportation released their report; saying they would evaluate introducing ride-hailing by Fall 2019 (about 18 months away). read the press release here.

The Province (newspaper) released today an exclusive that the taxi industry in BC is pushing the government for an alternative to Uber and Lyft. This alternative is a "made in BC solution", which allows British Columbians to have a ride share service (Kater), which operates at taxi prices.

The article can be found here.

I will attempt to keep my sarcasm to a minimum.

Here in BC, many people want Uber and Lyft to be present as this will increase competition in the industry and thus help lower the price of requesting a ride (taxi or otherwise). The taxi industry is clearly against this because it will severely erode their monopoly-level profits which they have been able to hold on to for so long. Case in point, since the introduction of Uber the price of a taxi medallion in NYC has collapsed from a height of $1.3 million to just under $200,000 ... we can infer that if individuals were willing to spend $1.3 million for the right to operate a taxi, the benefit received must have been at least equivalent if not more.

The comedy is that based off of the document presented, their view seems to be that we would just like a more convenient way to hail our taxi's (via app lets say) ... Thus by introducing this new hailing method and service (at current taxi rates), they satisfy the problem while maintaining their extra normal profits.

We do not just want an easier way to request a ride. we want to dismantle the ridiculous market power that the taxi-industry has been able to carve out for itself, introduce competition to the market, allowing market forces to determine the price of a ride and the service provided.

To be honest I was standing in line to buy coffee as I read this article. I had to do everything I could to keep myself from laughing. Does the taxi-industry seriously believe this is a legitimate proposal to satisfy our demands? Or are they staring down the barrel and offering any last-ditch effort they can to save themselves.

what are your thoughts? feel free to comment below.

Thursday, 12 July 2018

The Impact of Changing House Prices on GDP in BC

Source: https://www.armstrongeconomics.com/markets-by-sector/real_estate/real-estate-in-decline/
Yesterday (11th of July 2018) the Bank of Canada continued to increase interest rates, as many expected. 

Since the increase in the interest rate, the media coverage has been flooded with conversation around the impact this will have on homeowners. Specifically, it is well presented that Canadian households currently have a pile of debt and will have trouble continuing to service their debt if their payments or obligations increased. you can read a Bank of Canada article on the subject here.

Building off of these discussions, although quite separate, I began to wonder. Here in BC the Finance, Insurance and Real Estate (FIRE) industry make up essentially 25% of our provincial GDP.

As governments continue to engage in policies which aim to make housing more affordable (decrease or slow price growth) and as the Bank of Canada continues its upward movement of interest rates (decreasing the demand and supply of real estate); we have some serious headwinds on house price growth. The question of interest then: Given the size of the FIRE industry in BC, for some change in the house price, how does this filter through to impact our provincial level of output?

To answer this I conducted a simple time-series analysis which allowed me to jointly model both house prices (Teranet national bank composite house price index for BC) as well as the provincial GDP (Statistics Canada).

In order to ensure stationarity, these variables have a log-difference transformation applied to them, giving them the interpretation of the annual percent change. Each can be viewed independently below:


With these variables, I then apply a one standard deviation shock to the transformed House Price Index (HPI), which works out to be about a 4.6% point annual change in the index. Observing how this shock filters itself through both the HPI and GDP over time we see the impact of this shock. This impact is presented below.


First, evaluating the impact of a 4.6 percentage point shock to the House Price Index (HPI) on itself. What we witness is no big surprise, the housing price index jumps in the shocked year (year 1) and then slowly returns to it's normal. With a 95% Confidence level, this shock to house prices has been fully absorbed within 2 and a half years.

Recall we are dealing with growth rates here. Imagine the HPI is doing its thing, then, out of the blue, it jumps by 4.6 percentage points. the effect is an immediate increase in the index, followed by 2 and a half years of additional (but slowing) growth before returning to its pre-shock level of growth. 


Looking at the impact of a shock to the HPI on GDP we witness an impact which was expected. Our shock happens in year one, however, this does not filter through to impact our level of GDP until the second year. At this point, the GDP jumps to an estimated increase of 2 percentage points (fairly large given average growth rates of GDP). However, this impact quickly subsides and is showing no statistical effect 2 and a half years after the shock.

Through this, we can determine the elasticity of GDP to the HPI (for some % change in HPI, what is the impact on the % change in GDP). Thus we can determine the elasticity of GDP to be 0.435, meaning that GDP is not overly sensitive to a change in the HPI, that is GDP would be inelastic. Just the same we can take this to mean that for a 1% point change in the HPI, we would expect to witness a 0.435% point change in the GDP.

So, if we do see a collapse of house prices, this may filter into a bad few years for the BC Economy. Keep in mind, in 2014 when oil prices collapsed causing Alberta's GDP to collapse, Oil and Gas (with support services) accounted for aproximately 8% of Alberta's GDP. Given BC's reliance on the FIRE industry (25% of GDP), a collapse in the price of real estate could very well have a major impact on our provincial economy.

What are your thoughts on this, feel free to comment below.

Thursday, 14 December 2017

Minimum Wage in BC

Source: http://www.motherjones.com/

With all the discussion around minimum wage - particularly the push for a $15 minimum wage. I was recently asked my opinions on the matter. 

Although I have many, which are two-sided and highly contingent on our basic assumptions of market structure in hiring minimum wage employees, the point here is not to make a bunch of normative statements. 

From my readings, much of the literature seems to be split on minimum wage, for every study I have read which supports raising minimum wage due to some list of net benefits, there is another study which is against minimum wage for some list of net costs. 

Rather here. I wanted to briefly evaluate the minimum wage condition here in BC. 

the following utilizes minimum wage data over the last 20 years which I obtained from here and utilizing the all-items Consumer Price Index for both BC and Canada from here

using these data sets I created two plots.

first, in BC minimum wage is not indexed to inflation, as a result, it is set intermittently based on the political pressure of the time. 

thus the first plot (below) shows the nominal minimum wage compared to what the minimum wage would have been if it had been indexed to inflation. Here I have indexed it to both the Canadian inflation rate as well as the BC inflation rate for comparison. 


What we witness is that in relation to 1997, the minimum wage today is higher than it would have been if the minimum wage had been inflation adjusted. Keep in mind this was definitely not true between 2005 and 2012. 

The next plot (below) demonstrates the real minimum wage (in 2017) dollars over the last 20 years. Again this real wage is constructed using both Canadian and BC CPI data, then compared to the nominal. 

Nothing too surprising from this graph, most the intuition could have been pulled out of the previous by comparing an inflation-adjusted wage to the true wage. But what we witness is a reinforcement of our previous statement that minimum wage in real terms is higher today than it was 20 years ago. 

Due to the nearly 10 years of constant wage at $8.00/hr we see the outcome that between roughly 2003 and 2012 the real minimum wage was lower than it was in 1997. That is those individuals earning minimum wage saw a steady erosion of their purchasing power over this almost 10 year period due to inflationary pressures. It took nearly 2 years of increasing minimum wage, from about 2010 to 2012 for the real minimum wage to match its 1997 level before continuing to increase. 

Keep in mind this is strictly observational - there are no statements being made that 1997 was the proper minimum wage, which subsequently saw years of erosion. Nor is today's minimum wage necessarily a correct minimum wage either. 

Depending on our assumptions of labour markets minimum wage can either help correct a market failure (in the case of monopsony or oligopsony) or in any other case minimum wage will cause a market failure. 

Final note, because all around we are seeing a big push for $15/hr minimum wage. My big response to this is what makes $15/hr so special? based on the market situation, perhaps no-minimum wage might be optimal, perhaps $16.26 might be optimal. 

The takeaway is that, as far as I can tell, there is nothing special or optimal about a $15/hr minimum wage, rather it is a convenient, round, rally cry - where $14.12/hr just does not have the same ring to it. 

What are your thoughts? feel free to comment below. 


Wednesday, 29 March 2017

Comparison of BCAS and Vancouver Fire call types.

Image Source: http://www.gettyimages.ca/detail/illustration/icon-set-emergency-services-royalty-free-illustration/165723541
In my previous post, which can be found here. I evaluated the cost structure differences between Vancouver Fire and BC Ambulance (division of BCEHS) operations in Vancouver.

Here I am following up with a comparison of the breakdown of the types of calls Ambulance and Fire responds to. In my previous post, I mentioned that Vancouver Fire responds to nearly 50% of all Ambulances' calls and commented that given the much higher cost per call for Vancouver Fire that this may be a miss appropriation of public funds, as BCAS may be able to provide the same service for cheaper if they beefed up their resources.

Of course, the issue becomes. What if, the majority of calls which Vancouver Fire responds to are types of calls in which their special skills and training come into play adding a benefit over an additional ambulance crew. For example, if most of these calls are HAZMAT, Rescue, MVA (Motor vehicle Accident), or Fire (Burns). Then perhaps this high rate of call out is justified!

As promised, here is the breakdown of the calls received by BCAS in 2014 in Vancouver and corresponding Fire response based off of call category.

In the above bar chart (organized by highest to lowest frequencies of BCAS calls) we witness that the top five calls which BCAS responds to are for

  1.  Sick (12,393 calls)
  2. Unconcious (6107 calls)
  3. Psychiatric (4890 calls)
  4. Breathing Problems (3975 calls)
  5. Chest pain. (3672 calls)
At the same time the top give calls which Vancouver Fire responds to most are: 
  1. Sick (4157 calls)
  2. Unconcious (4015 calls)
  3. Breathing problems (3975 calls)
  4. Chest pain (3508 calls)
  5. Falls (2233 calls)
The part that I find most interesting about this, is that (as far as I know as an observer!) there is no added benefit of special skills from Fire in the response of these calls over having an additional paramedic crew respond.

Next, let's look at how many of BC Ambulances calls Vancouver responds to as a percent by call category. 
Right off the start - Fire responds to 100% of BC Ambulances HAZMAT calls. Just as I would have expected, the use of their specialized skill set to assist and aid in this situation. 

Next down, Fire also responds to 100% of breathing problems, 99% of Cardiac arrests, and 96% of chest pain. For these calls, I am struggling to understand what extra benefit Fire would provide over an extra ambulance crew (Any insight would be appreciated! as hopefully there is a rational)

What I find interesting is the other side where Fire only responds to 6% of the MVA's which Ambulance responds to (I am assuming that Ambulance only responds to the MVA's which are serious enough to justify). This I find interesting because if the accident is serious enough for Ambulance, might there be a need for Fire in this case as well?

This last graph is Ambulance and Fire response by call severity. from Alpha to Omega, which I understand is most serious to least serious. 

My (updated) understanding is that these call severities, in order from most severe to least, go Echo, Delta, Charlie Bravo, Alpha, Omega. Given this call ordering, our fire response perfectly lines up with the frequency of Fire response, with Fire responding to nearly all Echo and Delta calls and showing up with decreasing frequency as we move down the call severity. 

What are your thoughts on all of this? Feel free to comment below.

EDIT: A previous version had the order of call severities reversed, Thank you for bringing this to my attention in order to correct.

Sunday, 26 March 2017

Costs of Emergency Response: Comparing Ambulance in Vancouver with the Vancouver Fire Department.

Image Source: http://www.bcehs.ca/PublishingImages/BCAS_VAN_033012_113.jpg
A while ago I stumbled across this dataset which outlined the call volumes and types of calls which BCAS (BC Ambulance Service) responded to in the lower-mainland. Although I have plans to use this dataset for some future analysis. At an initial glance, what popped out at me was that the fire department responds on average to about 5% of BC Ambulances calls in the entire lower mainland but, close to 50% of calls in Vancouver itself. (in 2014)

This piqued my interest and got me wondering. What is the cost structure of the fire department? what is the cost structure of BCAS?

From a cost perspective, I have always wondered how cost effective it is to send 6 firefighters and the large fire truck to that many calls - both from a wage and capital cost perspective. Keep in mind, both BCAS and the Fire Department are paid for with public funds, just at different levels of government, provincial and municipal respectively.

Now, luckily the Vancouver fire department provides an extremely detailed breakdown of their previous years' activities in each municipal budget, these can be found here.  Unfortunately, BCAS provides a much less detailed public budget, as a result, I have had to do my best, scrounging together information from the above dataset, the BCAS 2014 annual report, which can be found here, and the BCAS 2014 Vancouver demand analysis which can be found here.

Compiling all this information I obtain the following table, which has also been augmented with wage data from workbc.ca


The big disclaimer here is that the BCAS expense data for Vancouver and the Lower mainland is entirely estimated at 25% and 50% based off of call volumes in relation to the provincial level. As such these are entirely arbitrary and may have no bearing on reality, but at least provide an insight into these areas.

While the expenses are estimated, the call volumes and labour information is accurate and obtained from the above-noted BCAS reports.

The second disclaimer is that Vancouver Fire provides their staffing information in terms of FTE, while BCAS provides it in terms of regular full-time, irregular full-time and part-time.

Through hear-say I understand that many of these "part-time" paramedics in Vancouver can, and often do, work more than a full-time schedule. But, at the risk of underestimating, I assign each part-time employee only 0.5 FTE while each full-time 1 FTE in calculating the FTE for BCAS in each region.

Finally, for the per crew information, BCAS generally operates in crews of 2 while I understand Vancouver Fire generally operates in crews of 4. (thank you, Brian, for this update! Also recognizing that Vancouver Fire will operate with as little as 2 for some medical calls. While this changes the number of FTE crew, this does not change the total expenses/call)

Now some discussion of the actual results of the above table.

My first surprise was that only 3% of the Vancouver fire departments calls are actually to deal with fires. Another 25% of their calls are fire inspections, to finish off with 72% of their calls being medical in nature, supporting BC ambulance. That means despite being a fire department (with their budget being about twice the estimated Vancouver BC ambulance budget) they primarily act in a capacity of being first responders to medical calls.

Now in a bit of preliminary research on this topic. I looked into the importance of first-responders, and empirically it appears that having a fast response time, all else equal, greatly increases the viability of the patient. My question then; does society benefit more when the first responder is from the fire department? or given the cost of fire response, would a modified response structure with BCAS be more cost effective and provide the same patient benefit?

Clearly, the Fire Department provides an extremely valuable service, especially in cases of vehicle accidents and hazardous materials. Unfortunately, I have not yet worked out from the above dataset, what percentage of Fire calls are due to hazmat or MVI (Motor Vehicle Incident), or just medical, with the request of a first-responder (Fire) crew. This will definitely, be the area of future follow ups! (followed-up here)

To finish off this post, as it has gotten a little long, If we evaluate the cost per call and the wage cost per call between calls in Vancouver for BCAS and the Fire Department we see that:
  • Vancouver Fire has a wage cost per call almost 8 times larger than BC ambulance.
  • Vancouver Fire has a total cost per call almost 3 times larger than BC ambulance. 
Although this data is already 3 years old and pre-fentanyl crisis, I find it fascinating that most of the news coverage on the crisis comes from the fire department, resulting in calls for more department funding when perhaps a more cost effective solution would be to increase ambulance funding and staffing.

But then again, these observations are just from a quick back of the envelope calculation. Perhaps there is much much more to the story. 

As I said my interest has been piqued and I now have a good chunk of data to pour over. 

Move over real-estate market, I have found a new topic for the next little while.

What are your thoughts? feel free to comment below.

EDIT: In retrospect, this article may seem like I have decided to pick a side in an emergency services battle for supremacy. This is not the case! Rather the above article is purely motivated by my curiosity and surprise based on the results and through this hopefully stir some thought on how these essential services may be provided in a more cost-effective manner!


Tuesday, 14 March 2017

Calls for extending the foreign home buyer tax

Image source: http://vancouver.ca/about-vancouver.aspx
If you have been watching the news, there have been recent calls to extend the Vancouver foreign home buyer tax (a 15% tax levied on foreign buyers of real-estate) from Vancouver to Toronto and Victoria as well.

some of these news articles can be found here, here, and here.

What I find amazing about these arguments for a foreign homebuyer tax is the covert racism that underpins it. That somehow, only foreigners are able to afford homes in such quantities that it stimulates demand and pushes up prices!

Specifically, (in my opinion at least) the problem is not foreigners willing to pay obscene amounts for homes - if they plan to reside in said homes. Rather, the problem becomes when individuals (whether domestic or foreign) are willing to pay obscene amounts for these homes because they view these as an investment rather than a form of shelter.

Let's compare and contrast two similar and current situations.

First, Imagine if you will, an individual from China decides to move to Vancouver and purchased a  $1 million dollar condo to live in, paying a $150,000 tax because they are not a Canadian citizen or permanent resident. However, this individual has planned to live in this home - maybe attending school, working, or starting their own business, all in Canada and contributing to local economy.

Meanwhile to contrast.

Second, a Canadian investor from elsewhere in Canada buys a condo in Vancouver for $1 million. Because this investor is domestic, he (she) pays no foreign homebuyer tax. At the same time, this investor is not residing in the condo, nor are they renting it out, as they are betting on the market appreciating and earning capital gains through this price appreciation.

What is the difference between these two cases?

In both cases, there was a new purchase of real-estate, adding to the demand for real estate in Vancouver.

the difference rests in what is done with that purchased real-estate.

In the first case, the foreign national has purchased the condo to live in, using it as shelter, thus jointly adding to the local economy, spending their money and spurring economic activity. (even if they are also hoping to sell in a few years for capital gains!).

In the second case, the domestic investor has purchased the condo to sit empty. thus adding to the demand for real-estate, but other than the initial contribution to the FIRE (Finance, Insurance, Real Estate) industry, there is no prolonged contribution to the local economy.

The question then - which scenario is more damaging?

Well, if real estate is viewed as just another good, then neither case is overly damaging, as in both cases both the buyer and seller are obtaining value from their transaction - which is why they transact!

However, if real estate is understood to be the primary form of shelter (a basic human need) then the second case clearly carries more social costs (increased demand pushing up the price while excluding others the use of the shelter.).

While the first case also adds to the demand, pushing up the price and excluding others the use of the shelter - we are also experiencing a continued contribution to our economy, through an addition to the labour force, additional consumer spending, and possibly investment, all of which helps spur the economy which may not happen in the pure real estate investment situation.

To wrap up, my personal feeling, and opinion. Is that there is a problem with the current real estate market, but that foreign buyers are not in themselves the problem, but rather an easy target. The problem lies in the use of real estate as an investment - something to be bought to earn a return rather than something to be used as a shelter. In this case, it is not that foreigners are the problem, but real estate investors in general, whether they be domestic or foreign.

Thus a foreign homebuyer tax is discriminatory, and perhaps even violates trade agreements which require laws to be enacted fairly over both domestic and foreign individuals and companies. Specifically, what should be evaluated is a changing tax structure to penalize real estate speculation in general, regardless of ethnicity - however, this is clearly easier said than done!

What are your thoughts on this? feel free to comment below.

EDIT: I want to clarify, real-estate investment in terms of a rental property is not really an issue in my mind and in fact should probably be encouraged. The issue becomes real estate investment in vacant properties for capital gains and given the recent census and many investigative news pieces, this appears to be a growing problem.

Tuesday, 28 February 2017

Present Value of shelter -- part 2

Image Source: https://clipartfest.com/download/c4caaa1fc43167db76f3e9cf0206708647023d40.html

Here is part two of a post that aims to evaluate housing as an investment ... where owners are expecting to earn an annual return (rent) as well as capital gains due to appreciating property values upon final sale.

in part 1 - I laid the groundwork as to the basic premise which would be used to evaluate the prices of real-estate.

recall -- that basically, the most a rational investor would be willing to pay for an investment is the present value of the income stream of the investment, with all future income being discounted by a corresponding equivalently risked market return. for a re-hash as to what this looks like, part 1 can be found here.

In this, we have to lay some basic assumptions out first.

  • housing in Victoria, BC (the CRD) has had an average growth rate of 5.07% per year from 2005 to 2016 based on the Canadian Real Estate Associations Housing Price Index (CREA HPI) which can be found here.
    • (For those familiar with the rule of 72 -- this estimates that if this continues, the price of housing will double approximately every 14.2 years.
  • Rent prices between 2015 and 2016 in the CRD increased on average by 5.77% although this does differ from a min of 4.9% for a 1 bedroom and up to a 6.8% increase for a 3+ bedroom, as determined by CMHC which can be found here
    • Recognizing that between 2015 and 2016 there was an influx of people into the CRD pushing up prices, coupled with not being able to have access to a longer time frame of rental prices, I have arbitrarily adjusted the annual growth rate of rental prices down to 4.5% from 5.77% as I feel this 5.77% is not representative of normal rental activity.
    • Second, BC tenancy act allows landlords to increase rent at 2% above inflation ... given a targeted inflation rate of 2%, this further seems to fit this assumption
  • For reference: Expected return over the last 61 years from an aggressive to a conservative portfolio is as follows: data obtained from here.
    • Aggressive portfolio (80% equity, 20% bond): 10.9% per year.
    • Moderate portfolio (60% equity, 40% bond): 9.8% per year.
    • Conservative portfolio (20% equity, 80% bond): 8.11% per year.
Recall we want to compare our payments from this investment in real-estate versus an equivalently risked investment -- Based on a preliminary search, the consensus seems to be that real-estate is less risky than equities, but riskier than bonds (due to potential maintenance problems, non-payment, periods of vacancy etc.). Thus perhaps around 9% similar to our Moderate portfolio may be good grounds to compare real-estate to (we will, in fact, calculate for an array of interest rates).

Presently we have the following price and rental situation in greater Victoria (CRD):

If we (as investors) were to assume that our annual house price was to continue to increase at 5.07% per year and that our annualized rental payment could be expected in to increase at 4% per year into the for seeable future, then we should expect the following present values if we hold on to the property for 30 years, collecting rent, and then willing to sell it for its market price.

Where if we sum up the present value of the future income streams over 30 years (discounting by the respective interest rates) we see that at the current market price -- If the interest rate is 7% then all real-estate regardless of unit type is a great buy! alternatively, as we move up to an 8% interest rate, one bedroom and three plus bedroom units are over priced. Finally, as we move up to a 9% interest rate, all units are over priced.  

Now perhaps investors are not actually looking to purchase real estate to invest in for a 30 year time period, so perhaps that is too long to consider. Thus, let's graphically look at the present value of each unit based off of its income streams over a 0,1,5,10,15,20,25 and 30 year time period. keep in mind that over a time period of zero, we have the current price of the unit. 

As this would be a bit too cumbersome to display in tables, we have graphs:

Updated: As was kindly pointed out to me, the previous graphs in this post were very misleading - the nature of a line graph seemed to show how the price of real-estate was expected to change over the next 30 years when this was not the case. the graph instead is demonstrating what the present value of real-estate is based on the period of time you hold it for as an investment.


At a 7% prevailing interest rate, all unit types are currently for sale for cheaper than their present value for all holding period.

As we move to an 8% prevailing rate, three or more bedrooms and one bedroom units initially have higher present values (for short holding periods) but quickly decrease.

 Finally, as we look at a 9% prevailing rate, we see rapidly falling present values for all holding periods greater than 1 year -- indicating that all unit types would be overpriced relative to their present value of future income.

As stated at the beginning, real estate as a risk class is considered less risky than equities, but riskier than bonds -- I arbitrarily assumed a rate of 9% based off of historical portfolio returns. It shouldn't however, be a surprise to learn that in recent years we have been in a lower interest rate environment, thus it is under this rationale that I have included a range of prevailing rates. To finish off, for reference, I will include one lower rate of 6% and the corresponding present values.


The takeaway? depending on our view of the prevailing interest rate on a similarly risky investment, current real-estate in the CRD could continue to increase, or could already be over-priced.

Of course -- all of this is extremely sensitive to our assumptions - especially the growth of real-estate and rental prices into the future ... if either of these begins to slow, then we have a very different story!

What are your thoughts -- should real estate be viewed as an investment? or strictly as a means to provide shelter? Feel free to comment below.


Thank you to Francis and Joel for your comments leading to this revision!


Thursday, 9 February 2017

Unoccupied houses

In a past post, I made a statement that when looking at household formations and the rate of new households being built it seemed that supply was outpacing demand, thus we should expect to see falling prices. Clearly, we are seeing the opposite with home prices.

I speculated that this may be due to investors purchasing houses for speculative capital gains, leaving them vacant. At the time this was pure speculation - then today I began noticing a number of news articles on the subject pulling data from the latest census.

it appears my speculations was not entirely wrong!

You can read my previous post here. Or view some of the related news articles here and here.

Keep in mind -- real-estate investing is not a bad thing. If those investments are being rented out to provide shelter, then shelter is still being provided. It is only when the price is being pushed up and shelter is being denied when we potentially have negative consequences and overall falling affordability for both owners and renters.

Keith

Wednesday, 25 January 2017

Relationship between incomes, maximum mortgage loans, and purchase prices in the CRD

My recent post on housing in BC, looking at the rates of household formation and new residential construction (can be found here) got me thinking - Based off of incomes, what is the maximum price which a household could afford when buying their residence?

In order to calculate this maximum, we need to know a few things.
  1. What is a household's gross income?
  2. What are the qualification criteria for a mortgage?

Well first, to address households gross income. Such data is not publically available at a household level. Instead what is available are mean and median household incomes, as well as incomes by household according to set income brackets.

For example, In the Greater Victoria Area (CRD), from the 2011 and 2006 census:

  • 2006 Median household income: $61,553 and Mean household income: $76,711
  • 2011 Median household income: $67,041 and Mean household income: $78,583

giving us an annual growth rate of Median and Mean Incomes equal to

  • Median household income growth rate: 1.72% per year
  • Mean household income growth rate: 0.48% per year

If we make the assumption that these growth rates are roughly constant, then we get:

  • 2016 median household income: $73,008
  • 2016 mean household income: $80,487
Then if we refer to the CRD gap analysis conducted in August 2015 which breaks the CRD population into different sized groups based on incomes. primarily the findings are:

Armed now with an estimated 2016 mean and median, as well as a bit of distributional information as to what percentage of the population fits into each category, I can now generate a simulated distribution of household income to approximate the above information.

Doing so we get a simulated income distribution of the CRD with:
  • Simulated Median household  income: $71,527
  • Simulated Mean household income: $80,704
  • Simulated Min household income: $0.2
  • Simulated Max household income: $1,551,000
  • Simulated Standard Deviation of household income: $61,692
which gives us an estimated income distribution for 2016 which looks like:
Next let's move to determine what is the maximum mortgage amount each household could qualify for, given their income.


To do so we need to make some general assumptions.
  1. Property taxes are constant at 0.8% of property value.
  2. The cost of heating one's home when averaged over the year is $100/mo.
  3. after considering the monthly payment for heat, property tax, and the mortgage, all other monthly debt payments account for less than 7% of a household's gross income. 
  4. The interest rate at which a household is qualified at is the 5 year fixed rate as posted by the Bank of Canada -- 4.64% as of the time I am writing.
These assumptions are needed due to the qualification requirements which are (simplified for this):
  • no more than 35% of gross income will be spent on Mortgage, Property taxes, heat.
    • hence the need for assumptions 1, 2 and 4.
  • no more than 42% of gross income will be spent on total debts. 
    • hence the need for assumption 3, as well as the others.
Recall we are looking at calculating the maximum mortgage or loan amount each household would qualify for given their income and the above assumptions. This does not mean the maximum purchase price they could afford as we have made no assumptions about the buyer's equity and down payment -- thus if we were to assume that buyers have only the minimum down payment available, then maximum mortgage amount would be expected to be similar to the maximum purchase price. 

Note: currently the Median price in the CRD is $645,000 while the Mean price is: $752,509

With these assumptions, we can calculate the maximum mortgage payment for each household, then if we work backward, figure out the maximum mortgage amount each household could afford. This can be seen below:

If we interpret this graphic we see that the average maximum mortgage (loan) amount is in the realm of $365,919 while the median maximum is at $321,128. 

Comparing these maximum mortgage amounts to the average and median purchase prices we are currently seeing in the CRD we have a large discrepancy. The big issue here is that clearly, not all households can afford to own, those who make up the bottom of the income distribution simply do not have the means to achieve home ownership. Thus, following the lead of the CRD gap analysis previously referenced, let's assume that only those households earning $80,000 a year or more are able to afford to buy a house. 

If we invoke this assumption, then we get a truncated distribution of maximum mortgage amounts, and a revised higher mean and median maximum mortgage, which can be seen below:


By eliminating the bottom part of our income distribution by assuming they are not able to participate in the housing market, we obtain a new, higher mean and median max mortgaged amount. Still, there seems to be a gap between these values and those of the mean and median purchase prices. for reference:
  • Median max mortgage $551,991 Vs Median purchase price $645,000.
  • Mean max mortgage $596,135 Vs Mean purchase price $752,509.
Based off of this we can begin to infer that: 
  1. Households are making massive down payments allowing them to reach purchase prices much higher than their maximum qualified mortgage amount.
  2. Given the recent inflation of house prices in the CRD, $80,000 a year is no longer representative of the threshold household income required to enter the housing market. 
  3. We may not be able to actually make inferential statements by comparing the maximum mortgage amounts and present purchase prices.
My last question becomes. If it is true that $80,000 is no longer the threshold household income to enter the housing market, which level of household income would yield a maximum mean and median mortgage amount similar to present housing prices?

The answer to that is a threshold household income equal to $125,000 yielding:
  • Median max mortgage $678,200 Vs Median purchase price $645,000.
  • Mean max mortgage $755,800 Vs Mean purchase price $752,509.
That is at this price, only the top 19.78% of households (roughly 1/5) could reasonably be expected to be able to participate in the housing market in the CRD.

What are your thoughts? feel free the comment below!


Friday, 6 January 2017

BC Housing markets

With the liberal government recently announcing (well almost a month ago now) that they would help first time home buyers with their down payment through an interest-free loan program (for first five years - more info can be found here) this got me thinking,

As many have commented, on the spectrum of purely political policy to good economic policy, this falls pretty close to the political extreme. Rob Gillezau has an excellent piece in Macleans titled "BCs new subsidy for homebuyers is pure politics and bad policy", where he discusses this further.

I don't overly want to discuss the actual policy being implemented here, but rather the idea of the housing market. I often hear from students and others that the price of housing is too high, that it should be much lower.

My response to this is usually along the lines of "what determines the price of a good?" - in this sense, where the sellers' minimum willingness to accept meets the purchasers' maximum willingness to pay, or put another way, when supply equals demand. Thus the price for housing from a natural perspective is neither too high or too low, but rather where it should be as determined by market forces.

This does not mean that the price of housing is right from a social perspective, so we begin to try to determine what is a "fair" price - the problem is, what is a "fair" price, and "fair" for who? As soon as we begin to try to pin a "fair" price onto a market, we are constructing an artificial price, and distorting the market (No comment as to whether this distortion would be good or bad! simply that it is a distortion).

So, back to the market price, where we are currently at. Gillezau in the above-mentioned piece, as well as many others (
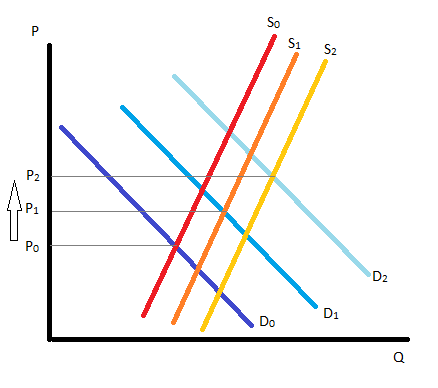
myself included), have contributed the rapidly rising house prices in BC to be due to a supply shortage. That is demand is rapidly increasing (shifting right) due to increasing population, low interest rates, etc. While supply is not able to keep pace, the result being a series of price increases due to excess demand.


At least that is the story which seems to make the most sense looking at the current situation. The question is what is actually happening? Is the demand for housing outpacing the ability to supply new units?

to take a look at this I pulled the following data sets:
to keep consistency between the two data sets, I only focus on the common years from 1999 to 2016.

Comparing the annual estimated increase to BC's population with residential starts we see the following:

here we see what we would expect, given the price situation, the population has outpaced new housing starts for almost the entire 17 years under evaluation.

But this is where we need to be careful, not everyone needs a house! most people tend to live with a few others all at the same residence. According to the latest census, the Canadian and BC average household size is 2.5 people, so if we take this into account we have a very different story.


Now we see almost the opposite case. With the exception of 2009, every year residential housing starts outpaced household formation. This is saying that supply has outpaced demand!

If this is the case we have excess supply and we should have been seeing house prices dropping across BC for the last 17 years, not increasing! This does not seem right, let's go back to what we know, in order to figure out what is happening.

  1. Prices have been drastically increasing across BC for the last 17 years.
  2. Housing starts have outpaced household formation.
For prices to be increasing, we must have either (a) demand growing faster than supply, or (b) supply shrinking. Clearly, supply has not been shrinking so something must have been missed in the demand. 

Arguably the excess demand is coming from the use of real estate as an investment over shelter (probably not a shocker to most!). that is if these properties are being purchased with the hope to "flip" them once they have appreciated enough in value, then we have our missing demand. 

While this may make sense ... the number here seems extraordinary! take a look at the proportion of housing starts to household formation:
On average (gray line) there have been 1.8 units built for every household formed. If these excess starts over household formations were captured by investors purchasing units, then price should have remained stable (growth of demand roughly equal to the growth of supply). What we have seen instead is skyrocketing prices, implying that there has been greater demand for residential units than have been supplied over these 17 years.

So where on average, 1.8 units have been built for every household formed (almost 2 units per household!) investment demand for units must have been even greater, perhaps in the realm that for every unit purchased due to a household being formed, another 1 to 1.5 was purchased for investment, not for shelter. 

I would love to see some data on vacant houses ... as 60 to 65% of BC lives between the CRD, Vancouver or Lower Mainland, I am a bit skeptical that there would be almost a vacant investment unit for every unit occupied! but maybe I am not looking.

If this is the case, then vacant investment properties are the cause for skyrocketing house prices, why isn't more done to restrict this? 
  1. Anyone who owned a house is more than happy to see their equity skyrocket and would be furious to see it collapse now.
  2. Anyone who has recently bought a house at this high price would be devastated if their house price collapsed.
  3. The FIRE (Finance, Insurance, Real Estate) industry is the driver of the BC economy. See here among other sources.
With all this in mind - Yes the new downpayment policy will further spur demand, creating an even greater upward pressure on prices. From the liberals' view, this will give the economy a little short-run kick, fueling the FIRE industry, and hopefully making everything look rosy so that we are all happy for election time.

What are your thoughts? good policy? just politics? anyone planning to take advantage of the loan?  anyone have any insight into investment purchases, I would love to see some data from that side to compare.

The high cost of low taxes - Fiscal Policy part 2

                 In this post, we will spend some time talking about the high costs of low taxes. This may seem somewhat paradoxical; we wil...