Showing posts with label Victoria. Show all posts

Saturday, 24 February 2018

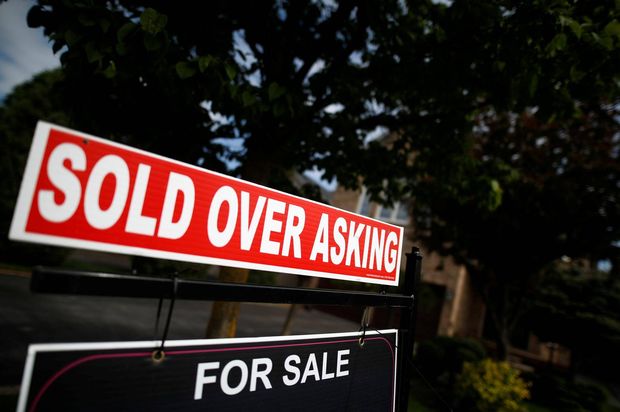
BC Budget - Housing

Source: https://www.facebook.com/homeiswhereitstarts/

As expected one of the big highlights of the recent BC Budget (yet to be passed in the legislature) is the focus on implementing new policies in order to deal with the housing affordability issues we have seen in BC over the last decade.

The full BC Budget can be found here, the highlights here, and finally the focus on the housing action plan here.

First some praises for the plan.

The plan, although not perfect, aims to deal with both demand and supply side problems currently being faced by the real-estate market. With these policies being aimed to cool demand and stimulate supply (Contrast this to previous policies such as 0% downpayment loans to help first time home buyers. A policy which further stimulated demand).

On the Demand side:

  • Introduction of a speculation tax.
  • Increasing the foreign buyers' tax from 15% to 20% and expanding this tax out of Metro Vancouver to include the Fraser Valley, CRD, and Okanagan.
  • Increasing property taxes (school tax rate) for properties over $3 million. 
  • Actions to prevent speculation and pre-sale condo re-assignments. 
On the Supply Side:
  • Government $6 billion dollar investment in affordable housing
    • 14,000 rental units for 'middle' working families.
    • increasing student residences at universities and colleges.
    • Providing changes to property taxes to encourage rentals. 
What does all this mean? Let's start working on the demand side followed by the supply. 

First the speculation tax, other than the announcement of the idea of a speculation tax, we know very little as to what this would entail, as a result, it is difficult to say what effect this may actually have on the market. Just the same, I am under the belief (normatively) that if effectively placed could have a significant impact on cooling the market. I have written several times on the role of speculation in the housing market, starting with this article here.

Second the Foreign Buyers Tax. I have written about this before as well. to be brief - I am not a fan of this policy. To read my reasons why you can find the previous post here.

Increasing property transfer taxes and school rate taxes for properties over $3 million: There is a part of this policy which seems satisfying. Ratchet up the taxes for those rich enough to afford a $3 million mansion, but keep in mind, many of the people who have found themselves owning multi-million dollar properties are seniors, on fixed incomes who have just always lived in their house and seen property values rise exponentially around them! 

I have witnessed several sad experiences where seniors have come into the bank, they had bought their property decades ago, out in the boonies, only to find that now their property has exploded in value, with the property taxes being so high that they can no longer afford to pay them through any method other than a reverse mortgage, or city lien on their property. 

Finally, actions to prevent speculative pre-sale re-assignments of condos. Again my belief is that this could be an effective policy, as with the speculation tax, however, the big question I have is what does this look like and how will it be enforced. 

To the supply side: 

A $6 billion dollar investment over the next ten years. Let me start by saying that a minority government releasing a spending plan over the next ten years is rather wishful and thus leaves me skeptical. 

I am not sure of the exact details or conditions of this $6 billion, so let's assume this money is available as financing, and funding for public institutions to increase rental housing and student residences. 

First, building 14,000 rental units for the 'middle'. This may be a great idea, but ultimately I feel it will fall into the slow molasses of municipality zoning and bylaw processes which many have argued to be the primary supply problem contributing to the current affordability crunch. Thus I am interested to see how this materializes.

If this does materialize and if this materializes as 14,000 new rental units, not just "14,000 rental units over the next 10 years" then this may have an effect of driving down rents in areas like the CRD and Metro Vancouver where rental affordability remains just as much of an issue as purchasing a home (near 0% vacancy rates in both regions). 

An increase in investment for student housing will also help to relieve the pressure on rental markets (again primarily in university towns such as Nanaimo, CRD, Lower Mainland and the Okanagan) by allowing students their own specific residence it frees up more rental units for the rest of the population, thus allowing an increasing vacancy rate and decreasing price pressure for rents. 

In conclusion, there are still a lot of unknowns with this housing action plan, but preliminary evaluation looks promising to slow (or temporarily) reverse the acceleration of home and rental prices through policies aimed at cooling the demand while stimulating the supply. 

In the coming weeks, I am sure the specifics of these policies will be revealed. Given the nature of politics, come that time I may have to retract the optimistic tone I have. 

What are your thoughts on this policy?  I have taken a rather one-sided approach in my discussion above, but all policies are going to have both winners and losers. Think about who the losers are following the imposition of these policies and what this means for them. 

Feel free to comment below. 

Thursday, 20 July 2017

Changes to enrollment priorities within SD 61.

Image Source: https://www.sd61.bc.ca/
A while back now, early June 2017, the Greater Victoria School District (SD 61) released a press release on the results of a survey they had sent out, as well as the resulting policy changes, a change in enrollment priorities within SD 61.

At the time I had a few parents bring this report to my attention, asking me to look into the survey results, as they felt that the released results were misleading, or rather that the proposed policy changes did not appear to line up with the opinions of most parents (in their view).

Initially, my first thought was "Everything is probably legitimate and it's great to see some evidence based decision making on the part of the school board" ... but within minutes of reading the press release, I began to wonder if this press release was the result of a rushed ad hoc job on the part of the school district, or if they were purposely trying to twist the evidence to support a pre-determined policy. Let's hope that it was the former and nothing sinister is at work here.

The full press release can be found here for those interested.

Early in the results, SD 61 claims that their survey had a 70% response rate. (starting page 12 of this document)
  • 3450 to the parent survey
  • 418 to the student survey
Yielding a total of 3868 respondents. 70% response rate, pretty good! (mind you no back ground as to the methodology as to how these surveys were distributed). 

The next bit is the geographical distribution of the respondents to the parent survey, I have created a little table (below) to demonstrate the breakdown including the relative frequencies as well as comparing these relative frequencies to the relative frequency of the population in each municipality and school aged children. Keep in mind, given limited access to data (and time on my part ... this is only a blog!) we are looking at different years for each of these points -- but we should expect the relative frequencies to stay relatively constant over this short time period:


The first thing we should notice is that despite the earlier claim of having 3450 parent respondents, we only have a geographical break down of 3168 surveys, meaning 282 (8.2%) of the respondents were not included or dropped for what ever reason.

The second thing we should notice is the large discrepancy between the relative frequencies of the municipalities - specifically, Saanich is grossly under represented while Oak Bay is grossly over represented. (The two yellow rows are identified as such as there are no true relative frequencies to compare these too).

Here is a bar chart of the above table -- because pictures are nice too.

So, page one (truthfully page 13 if you're following along) of the report so far - some questions raised, but perhaps nothing too misleading so far -- Let's explore the reported results of the survey.

The first thing to note is that these reported results are only from the parent survey, the details of the student survey are not presented. Again pay attention to the numbers here.

The first question is along the lines of enrollment priorities. specifically, should siblings have priority (in order to keep siblings together at same school) or should catchment students have priority? meaning siblings may be split between schools.

The results (as presented in the report) are as follows:
Based off of this - it seems as if a strong majority of respondents (almost 61%) support catchment school enrollment over keeping siblings together. But pay attention to the total respondents ... only 2971. Turns out 469 respondents "skipped" this question for one reason or another.

The big question then - is it important that 469 respondents skipped this question? should these 469 respondents be dropped from the results? or should we include these 469 as perhaps a "no opinion" category? Let's include these skipped responses and see how our relative frequencies change.

If we include these skipped responses -- now only 52.65% of respondents support catchment over siblings ... not such a loud statement anymore! Additionally, with the 469 skipped included, we only have 3450 respondents. What happened to the other 10 respondents?

Sadly as we move through the other responses we see a similar trend. we have 469 respondents who decided to skip a question, and were just completely omitted as a result.

We see the same situation here - The question being, who should have class priority each year, non-catchment returning students or new catchment students -- the reported results (omitting the skipped) say that almost 58% support returning non-catchment students. If we include the 469 who skipped the question, less than 50% support returning non-catchment students having priority, a sudden change in results if we are interested in majority support.

Again, total responses are only 3440, not the 3450 stated as total respondents. 10 are still missing.

The final reported question is asking about what should happen when students finish at their current school and are set to transfer to their middle or high school. Specifically, should out of catchment students simply follow the school path (certain elementary schools feed into specific middle schools etc.) or should these students be required to go to their catchment school, and have to apply to follow the school path. 

The interesting part of this question is that we only have 2914 responses, with no information about skipped responses or any hint about the other 536 omitted respondents. Do we assume that 536 (15.5%) of respondents skipped this question? Or did these 536 spoil their response, circling both answers? unfortunately, we have no insight, only that 2914 answered this question as opposed to 2971 which answered the prior two.

Sadly, it is reports and lazy statistics like this which are supporting government policy. The school board has already met and revised enrollment priorities based off of these results.

The biggest question I have is this. If there are so many errors in this 'polished' press release, can we trust any of the methodology or process used in determining any of these results? remember, all that is being presented in the above is summary statistics - we have to trust that the individuals who put this report together properly sorted, compiled and calculated these statistics properly. Given the issues, I have just raised - I have my doubts.

What are your thoughts on this? feel free to comment below.


Wednesday, 31 May 2017

The IMF on Canada's Housing Market

Image Source: Curry, Bill. Globe and Mail, "IMF warns of significant risks from Canada's housing market",https://beta.theglobeandmail.com/report-on-business/economy/imf-praises-infrastructure-bank-plan-flags-housing-market-concerns/article35160977/?ref=https://www.theglobeandmail.com&service=mobile
Recently came across this article in the globe and mail, the full article can be found here. It seems that once again the IMF is warning Canada that our housing market is overheated and that this may have serious consequences for future economic performance.

Here the IMF notes how the Canadian banks credit ratings were recently downgraded expressing fears over the number of consumer loans and mortgages on their books and the potential risk that they present given the exceptionally high levels of consumer debt.

I was happy to see this little bit in the report:
Ms. Lim's staff statement also took issue with the foreign buyers tax approach introduced in British Columbia and Ontario that "discriminates against non-resident buyers." The IMF states that non-resident activity is not the sole driver of housing prices and the provinces should replace the foreign-buyers taxes with more effective tax changes aimed at discouraging speculative activity.
Where the emphasis is my own.

What are your thoughts on this? Are we heading for a correction? Or, alternatively, is there too much on the line for the government to allow a housing correction to actually happen? If that is the case, can we have this hypothesized 'soft landing'?

feel free to comment below.

Tuesday, 28 February 2017

Present Value of shelter -- part 2

Image Source: https://clipartfest.com/download/c4caaa1fc43167db76f3e9cf0206708647023d40.html

Here is part two of a post that aims to evaluate housing as an investment ... where owners are expecting to earn an annual return (rent) as well as capital gains due to appreciating property values upon final sale.

in part 1 - I laid the groundwork as to the basic premise which would be used to evaluate the prices of real-estate.

recall -- that basically, the most a rational investor would be willing to pay for an investment is the present value of the income stream of the investment, with all future income being discounted by a corresponding equivalently risked market return. for a re-hash as to what this looks like, part 1 can be found here.

In this, we have to lay some basic assumptions out first.

  • housing in Victoria, BC (the CRD) has had an average growth rate of 5.07% per year from 2005 to 2016 based on the Canadian Real Estate Associations Housing Price Index (CREA HPI) which can be found here.
    • (For those familiar with the rule of 72 -- this estimates that if this continues, the price of housing will double approximately every 14.2 years.
  • Rent prices between 2015 and 2016 in the CRD increased on average by 5.77% although this does differ from a min of 4.9% for a 1 bedroom and up to a 6.8% increase for a 3+ bedroom, as determined by CMHC which can be found here
    • Recognizing that between 2015 and 2016 there was an influx of people into the CRD pushing up prices, coupled with not being able to have access to a longer time frame of rental prices, I have arbitrarily adjusted the annual growth rate of rental prices down to 4.5% from 5.77% as I feel this 5.77% is not representative of normal rental activity.
    • Second, BC tenancy act allows landlords to increase rent at 2% above inflation ... given a targeted inflation rate of 2%, this further seems to fit this assumption
  • For reference: Expected return over the last 61 years from an aggressive to a conservative portfolio is as follows: data obtained from here.
    • Aggressive portfolio (80% equity, 20% bond): 10.9% per year.
    • Moderate portfolio (60% equity, 40% bond): 9.8% per year.
    • Conservative portfolio (20% equity, 80% bond): 8.11% per year.
Recall we want to compare our payments from this investment in real-estate versus an equivalently risked investment -- Based on a preliminary search, the consensus seems to be that real-estate is less risky than equities, but riskier than bonds (due to potential maintenance problems, non-payment, periods of vacancy etc.). Thus perhaps around 9% similar to our Moderate portfolio may be good grounds to compare real-estate to (we will, in fact, calculate for an array of interest rates).

Presently we have the following price and rental situation in greater Victoria (CRD):

If we (as investors) were to assume that our annual house price was to continue to increase at 5.07% per year and that our annualized rental payment could be expected in to increase at 4% per year into the for seeable future, then we should expect the following present values if we hold on to the property for 30 years, collecting rent, and then willing to sell it for its market price.

Where if we sum up the present value of the future income streams over 30 years (discounting by the respective interest rates) we see that at the current market price -- If the interest rate is 7% then all real-estate regardless of unit type is a great buy! alternatively, as we move up to an 8% interest rate, one bedroom and three plus bedroom units are over priced. Finally, as we move up to a 9% interest rate, all units are over priced.  

Now perhaps investors are not actually looking to purchase real estate to invest in for a 30 year time period, so perhaps that is too long to consider. Thus, let's graphically look at the present value of each unit based off of its income streams over a 0,1,5,10,15,20,25 and 30 year time period. keep in mind that over a time period of zero, we have the current price of the unit. 

As this would be a bit too cumbersome to display in tables, we have graphs:

Updated: As was kindly pointed out to me, the previous graphs in this post were very misleading - the nature of a line graph seemed to show how the price of real-estate was expected to change over the next 30 years when this was not the case. the graph instead is demonstrating what the present value of real-estate is based on the period of time you hold it for as an investment.


At a 7% prevailing interest rate, all unit types are currently for sale for cheaper than their present value for all holding period.

As we move to an 8% prevailing rate, three or more bedrooms and one bedroom units initially have higher present values (for short holding periods) but quickly decrease.

 Finally, as we look at a 9% prevailing rate, we see rapidly falling present values for all holding periods greater than 1 year -- indicating that all unit types would be overpriced relative to their present value of future income.

As stated at the beginning, real estate as a risk class is considered less risky than equities, but riskier than bonds -- I arbitrarily assumed a rate of 9% based off of historical portfolio returns. It shouldn't however, be a surprise to learn that in recent years we have been in a lower interest rate environment, thus it is under this rationale that I have included a range of prevailing rates. To finish off, for reference, I will include one lower rate of 6% and the corresponding present values.


The takeaway? depending on our view of the prevailing interest rate on a similarly risky investment, current real-estate in the CRD could continue to increase, or could already be over-priced.

Of course -- all of this is extremely sensitive to our assumptions - especially the growth of real-estate and rental prices into the future ... if either of these begins to slow, then we have a very different story!

What are your thoughts -- should real estate be viewed as an investment? or strictly as a means to provide shelter? Feel free to comment below.


Thank you to Francis and Joel for your comments leading to this revision!


Saturday, 25 February 2017

Present Value of shelter -- part 1

Here comes another post about the housing market in BC as the news keeps peaking my interest along different avenues of this topic.

This time I began to wonder if maybe the driving demand for housing is not at all for shelter -- but what if the primary consumers of real-estate saw real-estate as an investment. That is, a place to park their capital in order to earn a decent return.

This idea was spurred by a recent article the tyee, an independent online newspaper written by Geoff Dembicki which can be found here.

I'm not sure I fully agree with all the conclusions made in the article, but just the same it made me think. If real-estate is primarily seen as an investment, then we could realistically obtain a price for real-estate based on the expected returns to be had over time.

First, this will be long enough to describe the methodology, the basic concept by which we will attempt to measure the present value of housing. Thus for this post, part 1, I will strictly be discussing one way to determine the price of an investment, while in a follow-up post I will apply this method to the housing market to explore the effects.

The way I normally teach this premise is to introduce the idea of some magic machine that you can buy and put in your house. This machine then regularly creates money, such that it generates $1000 a year. Now this machine is only capable of doing this for two years, then runs out of its magic. Despite the loss of the magic, the machine is still worth $5,000 for the scrap metals and parts - thus it can still be sold after it stops producing your money.

Based off of this -- I ask, "What is the absolute most you are willing to pay for this machine?" typically the answer is $7000 ($1000 from each year and the $5000 you sell the machine for) The rationale being that if you paid $7000 for this machine, you neither made or lost money -- thus it would be the most you would be willing to pay.

Well, the problem with this answer is - If I offered $7000 today or $7000 in 2 years - which would you take? Most rational individuals would take the $7000 today because they to a degree discount the future.

Alternatively, they know that even if they have no need for the money today, but might in 2 years time, if they take the $7000 today and invest it at a market rate of return they will have more than $7000 in two years.

In this same way, the $1000 we earn from the machine at the end of year 1 is less than $1000 today, and the $5000 we sell the machine for at the end of the two years is less than $5000 today. Thus we need to discount these values based on the market interest rate.

Thus we say the present value (maximum we are willing to pay) for this machine would be equal to:


Thus in each year, we discount the payment (and the final sale price) by the equivalent interest rate we could have earned, had we instead bought an equivalent risk-adjusted item in the market.

Thus if we assume a similar case would have held an interest rate of 5% we have the following maximum willingness to pay for this magic machine:

Thus the absolute most you would be willing to pay for this machine is $6394.56 as this is the amount that if you had today, would yield $7000 in over 2 years time at the given interest rate.

In this sense - If the current price of this machine is anything less than $6394.56 then you buy this machine without hesitation because it will be making some positive amount of money for you.

That is, to put it a different way -- $7000 in two years is worth $6394.56 to you today ... thus if you could pay $6200 in order to get this machine, you have instantly made $194.56.

In a follow up post I will take this basic premise an apply it to the real-estate market.

Wednesday, 25 January 2017

Relationship between incomes, maximum mortgage loans, and purchase prices in the CRD

My recent post on housing in BC, looking at the rates of household formation and new residential construction (can be found here) got me thinking - Based off of incomes, what is the maximum price which a household could afford when buying their residence?

In order to calculate this maximum, we need to know a few things.
  1. What is a household's gross income?
  2. What are the qualification criteria for a mortgage?

Well first, to address households gross income. Such data is not publically available at a household level. Instead what is available are mean and median household incomes, as well as incomes by household according to set income brackets.

For example, In the Greater Victoria Area (CRD), from the 2011 and 2006 census:

  • 2006 Median household income: $61,553 and Mean household income: $76,711
  • 2011 Median household income: $67,041 and Mean household income: $78,583

giving us an annual growth rate of Median and Mean Incomes equal to

  • Median household income growth rate: 1.72% per year
  • Mean household income growth rate: 0.48% per year

If we make the assumption that these growth rates are roughly constant, then we get:

  • 2016 median household income: $73,008
  • 2016 mean household income: $80,487
Then if we refer to the CRD gap analysis conducted in August 2015 which breaks the CRD population into different sized groups based on incomes. primarily the findings are:

Armed now with an estimated 2016 mean and median, as well as a bit of distributional information as to what percentage of the population fits into each category, I can now generate a simulated distribution of household income to approximate the above information.

Doing so we get a simulated income distribution of the CRD with:
  • Simulated Median household  income: $71,527
  • Simulated Mean household income: $80,704
  • Simulated Min household income: $0.2
  • Simulated Max household income: $1,551,000
  • Simulated Standard Deviation of household income: $61,692
which gives us an estimated income distribution for 2016 which looks like:
Next let's move to determine what is the maximum mortgage amount each household could qualify for, given their income.


To do so we need to make some general assumptions.
  1. Property taxes are constant at 0.8% of property value.
  2. The cost of heating one's home when averaged over the year is $100/mo.
  3. after considering the monthly payment for heat, property tax, and the mortgage, all other monthly debt payments account for less than 7% of a household's gross income. 
  4. The interest rate at which a household is qualified at is the 5 year fixed rate as posted by the Bank of Canada -- 4.64% as of the time I am writing.
These assumptions are needed due to the qualification requirements which are (simplified for this):
  • no more than 35% of gross income will be spent on Mortgage, Property taxes, heat.
    • hence the need for assumptions 1, 2 and 4.
  • no more than 42% of gross income will be spent on total debts. 
    • hence the need for assumption 3, as well as the others.
Recall we are looking at calculating the maximum mortgage or loan amount each household would qualify for given their income and the above assumptions. This does not mean the maximum purchase price they could afford as we have made no assumptions about the buyer's equity and down payment -- thus if we were to assume that buyers have only the minimum down payment available, then maximum mortgage amount would be expected to be similar to the maximum purchase price. 

Note: currently the Median price in the CRD is $645,000 while the Mean price is: $752,509

With these assumptions, we can calculate the maximum mortgage payment for each household, then if we work backward, figure out the maximum mortgage amount each household could afford. This can be seen below:

If we interpret this graphic we see that the average maximum mortgage (loan) amount is in the realm of $365,919 while the median maximum is at $321,128. 

Comparing these maximum mortgage amounts to the average and median purchase prices we are currently seeing in the CRD we have a large discrepancy. The big issue here is that clearly, not all households can afford to own, those who make up the bottom of the income distribution simply do not have the means to achieve home ownership. Thus, following the lead of the CRD gap analysis previously referenced, let's assume that only those households earning $80,000 a year or more are able to afford to buy a house. 

If we invoke this assumption, then we get a truncated distribution of maximum mortgage amounts, and a revised higher mean and median maximum mortgage, which can be seen below:


By eliminating the bottom part of our income distribution by assuming they are not able to participate in the housing market, we obtain a new, higher mean and median max mortgaged amount. Still, there seems to be a gap between these values and those of the mean and median purchase prices. for reference:
  • Median max mortgage $551,991 Vs Median purchase price $645,000.
  • Mean max mortgage $596,135 Vs Mean purchase price $752,509.
Based off of this we can begin to infer that: 
  1. Households are making massive down payments allowing them to reach purchase prices much higher than their maximum qualified mortgage amount.
  2. Given the recent inflation of house prices in the CRD, $80,000 a year is no longer representative of the threshold household income required to enter the housing market. 
  3. We may not be able to actually make inferential statements by comparing the maximum mortgage amounts and present purchase prices.
My last question becomes. If it is true that $80,000 is no longer the threshold household income to enter the housing market, which level of household income would yield a maximum mean and median mortgage amount similar to present housing prices?

The answer to that is a threshold household income equal to $125,000 yielding:
  • Median max mortgage $678,200 Vs Median purchase price $645,000.
  • Mean max mortgage $755,800 Vs Mean purchase price $752,509.
That is at this price, only the top 19.78% of households (roughly 1/5) could reasonably be expected to be able to participate in the housing market in the CRD.

What are your thoughts? feel free the comment below!


The Langford Budget: There are No Solutions, Only Trade-offs

  Image Generated with Google Gemini I don’t often shift to this perspective on this blog, but today I am putting on my hat as a Langford Ci...