Showing posts with label taxes. Show all posts

Wednesday, 11 February 2026

The Langford Budget: There are No Solutions, Only Trade-offs


Image Generated with Google Gemini

I don’t often shift to this perspective on this blog, but today I am putting on my hat as a Langford City Councillor. The financial trade-offs currently before the City are a real-world application of the economic principles we evaluate in the classroom: opportunity costs, unfunded liabilities, and the "Trolley Problem" of governance.

As a Councillor, I am often asked why our tax increases seem high in percentage terms. To answer that, we have to look past the "sticker shock" of a percentage and look at the values reflected in our budget.

The Context: A Small Number vs. A Big Reality

It is important to acknowledge that a 15% increase on a small tax base looks very different than a 5% increase on a large one.

The Math: A 5% increase on a $100 bill is $5. A 15% increase on a $20 bill is only $3. While the percentage is three times higher, the actual dollar magnitude is lower.

I developed a Comparative Tax Tool to provide people with data sourced directly from the Province of BC (Schedule 704). Even with recent increases, Langford remains one of the most affordable municipalities in the CRD and the province. We are an outlier in percentage change because, for decades, Langford artificially kept rates low by effectively borrowing from our future.

From Legacy Subsidies to Community Equity

For years, Langford’s reputation was maintained through a specific set of fiscal maneuvers: selling off public land and using developer amenity funds to subsidize general operations.

In economic terms, this was a legacy subsidy. By liquidating collective assets (land owned by everyone) to keep property taxes artificially low, the city provided a direct financial transfer to established property owners, disproportionately benefiting those with the largest assets.

We have been moving away from a system that prioritized a select few at the expense of our city’s future. As a newer resident myself, I am acutely aware of the cost of this transition. Many of us are now paying to correct a system we didn't create, fixing an physical and social infrastructure deficit that was left to us as a "parting gift" from a previous era.

This transition is about fairness across generations. Instead of liquidating public assets to grant a 'discount' to those who have been here the longest, we have been choosing to build a city that works for everyone. I recognize this comes with a significant cost today, one that I am paying alongside you. But the reality is simple: we either pay the true cost of our city today, or we leave our children to pay it tomorrow with interest.

Investing in Our Values

Over the past two years, we have made deliberate choices to move toward long-term stability and ensuring that tax-payer funds are being used to have as wide-reaching benefit as possible:

Healthcare Access: In partnership with the Masons and South Island Primary Care Society, we invested $1.7M to provide space for up to 10 doctors, creating a healthcare home for over 12,000 residents.

Childcare: We secured over $10M in grant funding for 100+ daycare spaces, co-located with housing and arts centers.

Public Safety: We transitioned our fire hall from volunteer to 24/7 staffing allowing the long empty hall in happy valley to be fully staffed. Additionally we have authorized a nearly 20% increase in RCMP officers.

Community Wealth: We secured Woodlands Park at a discount (Thanks to a tremendous community donation) and kept the YMCA/Aquatics Centre open, a move set to save taxpayers over $100M over the next 20 years compared to the previous Public-Private-Partnership model which was liability-heavy.

Asset Management: We have the stage set to fund a plan so that we pay for the roads and infrastructure we use today, rather than leaving a bankrupt infrastructure to our children (look no further than Calgary to see what happens when this isn’t funded).

The Trolley Problem: 15% vs. 3%

As we look at the 5-year financial plan, we are faced with two extreme tracks.

Track A: The 15% Path (Investment & Solvency) This includes an 8% baseline increase for "uncontrollable" costs: provincial downloads (E-Comm), RCMP contracts, and debt. The remaining portion allows us to repay "internal borrowing" debt the city took from its own future with no repayment plan going back to early 2000. This path maintains our festivals, beautification, and emergency services.

Track B: The 3% Path (Cuts & Liabilities) To get to 3%, we pull the lever and the trolley hits:

Safety: No new RCMP members.

Culture: Cutting three or more major community festivals.

The Future: Failing to pay back internal borrowing, effectively "selling the furniture to pay the rent," much like the 2018-2022 term where an estimated $20M in land was sold to bridge gaps.

The Bottom Line

There are no "easy" solutions. Anything below an 8% increase is not a saving; it is a service cut and a debt-load shifted to the next generation. Anything above 8% is an active investment in making Langford a modern, self-sustaining city, but a cost we have to pay today. 

We must decide: Do we continue on the track toward paying the true cost of our city today, or do we return to the path of borrowing from the Langford of tomorrow?

Thursday, 13 November 2025

Traffic Isn't Just Congestion, It's A Market Failure


Traffic Congestion


   For any of the nearly one hundred thousand residents of the Westshore of the Capital Regional District who endure a morning commute into the CRD core, you are intimately familiar with the reality of a club good being provided at zero user cost. Traffic congestion is currently high, fueled partly by population growth and largely by the ongoing construction for the addition of bus-on-shoulder lanes.

    I recently discussed this scenario in one of my classes. Given the significant interest the topic generated, it seems timely to dust off this old blog and provide an economic overview of the subject for the few nerds like me out there that like this kind of stuff, but more over and especially to counter the common rhetoric that expansions of bus or bike lanes are purely ideological.

    To effectively analyze the problem, let's abstract from reality and simplify the scenario into a more manageable framework.

Establishing Capacity and the Club Good Framework

    Let's begin by looking at a single lane of traffic. Based on data from the Highway Capacity Manual, a single lane is estimated to move between 1,500 and 2,000 People Per Hour (PPH). For our analysis, we will use the midpoint: 1,750 PPH.

Note: As the proportion of large SUVs, trucks, or commercial vehicles increases, the PPH capacity would be expected to fall. We will, however, presume the 1,750 PPH average works for our purposes.

    The defining characteristics of a club good are that it is Non-Rivalrous (up to a certain capacity) and Excludable (whether it is excluded is a policy choice).

  • Non-Rivalrous (up to capacity): A rival good, like a cookie, is consumed solely by one person and thus only that person gets the benefit from the consumption. A non-rivalrous good, like a swimming pool, can be used simultaneously enjoyed by many people. Up to capacity, adding one more person does not diminish the benefit for others. Once the capacity is exceeded, the good becomes congested, and adding the last person begins to reduce the benefit for everyone, at that point, it becomes rivalrous, adding an external cost onto the society of people trying to use it.

  • Excludable: This refers to the ease with which access can be restricted to those who pay. Like a cookie or a swimming pool, a road is excludable. However unlike a cookie or a swimming pool, we choose not to charge for road access. But It is entirely feasible to implement road tolls and collect a user fee; the fact that we don't is purely a policy choice.

The Efficient and Inefficient Outcomes

    Given a downward-sloping demand (Marginal Benefit) curve, with a price of zero, the quantity demanded occurs where the curve intersects the horizontal axis. For our example, let's arbitrarily set this quantity demanded at 1,500 PPH.

    
    Under the assumption that we are below capacity, this is an efficient outcome. The social and private cost of an additional person traveling on the roadway is essentially zero. Therefore, the allocatively efficient price for this good (P=MSC) is, in fact, zero.

    But what happens when demand begins to exceed the road's capacity? This could be due to rising population, or simply the surge of rush hour demand.:

    This surge in demand to 2,000 PPH at a price of zero pushes us beyond the 1,750 PPH capacity. The excess 250 PPH attempting to use the road creates congestion, which adds external costs to the rest of society. These costs manifest as:

  1. Increased Commute Time: (Time is money).

  2. Increased Accidents: Leading to higher insurance premiums for all motorists.

    The result is that more people choose to drive than the roadway can handle, creating negative, harmful costs that are generally paid by all of us.

The Solutions: A Comparative Analysis

    While there are many potential solutions, we will evaluate four options for their economic efficiency and effectiveness in the context of our 2,000 PPH rush hour demand:

  1. A market-based solution.

  2. Adding another general-purpose vehicle lane.

  3. Adding a dedicated bus lane.

  4. Adding a dedicated bike lane.

    Of course there are many more solutions we could consider, but for brevity (this will be long enough) we will evaluate these 4 options. 

Market Based Solution

   The most economically sound, market-based solution is congestion pricing. The government imposes a variable toll system based on the Marginal External Cost (MEC). As the number of drivers exceeds capacity, incurring an external cost on society, the toll increases to explicitly charge users for the costs they impose on others. When traffic is below congestion, the toll is zero.

Benefits:

  • Internalizes External Costs: It charges the users causing the problem, whose funds can then be used to pay for alternatives.

  • Incentivizes Behavior Change: Users now face an economic incentive. Some will shift to non-peak travel times or alternative modes of transportation, freeing up the road for those who cannot easily transition.

The Political Hurdle: This is often the most vehemently opposed solution, even by those who champion market forces. Why? People naturally resist paying for something that was previously free (a key parallel is the carbon tax, which charges for the external cost of pollution choices). Furthermore, this solution does not necessarily eliminate congestion; it only reduces congestion while also generating funds by charging the users who had created the costs to offset the external costs that would otherwise be paid through other means (e.g., increased insurance and general taxation). 

Adding another lane

    For simplicity, let's assume the government already owns the right-of-way and can expand the roadway without acquiring extra land.

    The common expectation is that two lanes equal 3,500 PPH capacity (1,750 x 2). However, the Law of Diminishing Returns applies. The second lane will have lower capacity due to the friction created by lane changes and merging, etc. Let's suppose the additional lane adds 1,250 PPH, bringing the total capacity up to 3,000 PPH.

    Our current 2,000 PPH rush hour demand is now well below capacity. Ignoring the well-studied phenomenon of induced demand (where new capacity incentivizes people who previously avoided traffic to now drive, leading to a concurrent surge in demand), this simplistically solves the congestion problem.

The Cost:

    A conservative estimate for building and maintaining a (3.5m x 1m) section of roadway over its 25-year lifespan is approximately $2,000 per meter. To pay for this extra lane, we need to raise $2,000 per meter through general taxation.

  • Taxation Implication: Since this solution does not include a toll, the funds must be raised through general taxation, taxing everyone regardless of whether they drive on this road.

    (A note on the "Gas Tax": These funds are not dedicated solely to roads, and even if they were, they are estimated to cover only about 60% of the cost, covering only the maintenance of existing roads not expansion, leaving the expansion for the general taxpayer to cover.)

  • Cost per Person/Capacity:

    • Total Cost per Current Capacity: $2,000 / 2,000 PPH = $1 PPH (per meter)

    • Total Cost per Future Capacity: $2,000 / 3,000 PPH = $0.67 PPH (per meter)

    As increasing the capacity has benefits that accrue into the future, it makes sense for at least part of this project to be paid for through debt financing, this way the future members of society who move to the area end up contributing to this cost as their future tax dollars will go towards paying some of this debt cost. 

Adding a Bus Lane

    This is similar to the ongoing construction on the Trans-Canada Highway between the Westshore and Victoria core. We will assume it has the same paving cost per meter as a vehicle lane: $2,000.

The Capacity Difference:

    A dedicated bus lane has an estimated capacity of 6,000 - 8,000 PPH, for an average of 7,000 PPH.

  • For the same cost as adding a vehicle lane, we increase the highway's total PPH capacity from 1,750 to 8,750.

  • Our 2,000 PPH demand now uses only 23% of the total network capacity, providing significant excess capacity for future growth.

Impact on Congestion:

    To bring the existing vehicle lane (1,750 PPH) back down to capacity, only 250 of the 2,000 current drivers need to switch to the bus (12.5% of peak demand).

  • Why does the bus lane look empty? Let's assume 500 PPH switch to the bus.

    • The driving lane drops from 114% capacity (2,000/1,750) to 86% capacity (1,500/1,750), it flows smoothly.

    • The bus lane operates at only 7% capacity (500/7,000).

    The same 500 people who accounted for 28% of the congestion in the driving lane now take up only 7% of the bus lane's capacity. This is a far more efficient and cost-effective way to move people.

  • Cost per Person/Capacity (Bus Lane):

    • Total Cost per Current Capacity: $2,000 / 2,000 PPH = $1 PPH (per meter)

    • Total Cost per Future Capacity: $2000 / 8750 PPH = $0.23 PPH (per meter)

    This is approximately 34% of the cost per person/capacity versus adding an additional vehicle lane based on future capacity - again a valid comparison as again it would make the most sense to partly debt finance this so that future beneficiaries also end up bearing some of the cost.

Adding a bike lane

    The cost of adding and maintaining a bike lane is typically a fraction of a vehicle lane's cost, partly because it can often be done on an existing shoulder and a single car trip causes vastly more road damage than a single bike trip. (Estimated that you would need over 15,000 bike trips to do same damage as a single average vehicle trip)

    To maintain a conservative analysis, let's adjust the cost based on size: a typical bike lane (1.5m x 1m) is 43% the width of a vehicle lane (3.5m x 1m).

  • Estimated Cost: $2,000 x 0.43 = $860 per meter of bike lane.

The Capacity Difference:

    Bike lane capacities are estimated at between 2,500 and 5,500 PPH. We will use the average: 4,000 PPH.

  • Adding this lane brings the full capacity of the network up to 5,750 PPH (1,750 + 4,000).

Impact on Congestion:

    You will hear drivers say: "But I can't bike! I have to carry groceries, ferry my kids to hockey practice, or haul tools to work!"

And that is precisely the point.

    The goal is not to force you onto a bike for every trip. The goal is to provide a safe, efficient alternative for the 2,000 PPH creating the congestion. If, for instance, 500 (25%) of trips can be completed by bike for the trip: 

(I only chose 500 for an easy round number, and consistency as it was the value I picked for the same reason for the transition to bus)

  • The driving lane reduces from 114% capacity to 86% capacity (it flows smoothly).

  • You get to keep your car for those essential trips, like hauling kids and groceries, but you will now encounter significantly less congestion because others have chosen to use the high-capacity alternative.

    Meanwhile, once again (given the extreme efficiency of the bike lane) this bike lane will tend to look empty as those 500 people only account for 12.5% capacity (500/4,000)

Cost per Person/Capacity (Bike Lane):

    • Total Cost per Current Capacity: $860 / 2,000 PPH = $0.43 PPH (per meter)

    • Total Cost per Future Capacity: $860 / 5,750 PPH = $0.15 PPH (per meter)

This is the most cost-efficient option, representing only about 22% of the cost of an additional travel lane and 65% of the cost of the bus lane.

Conclusion

    The next time you hear someone claiming that building bike or bus lanes is a waste of money or "entirely ideological," consider the economic facts.

    Building additional general-purpose vehicle lanes is by far the most expensive and least efficient way to add capacity to the system, resulting in the largest requirement for taxation increases. Conversely, shifting public funds into bus and bike lanes, for a fraction of the cost, provides vastly higher capacity, which saves all taxpayers significant money in the long run. Thus, building bus and bike lanes is not an inefficient, ideological, or wasteful expenditure; it is the most cost-effective, efficient, and fiscally conservative option to increase the operational capacity of the road network.

    That being said, we must acknowledge that the Law of Diminishing Returns applies universally. Currently, we have a relative abundance of vehicle travel lanes, which is why an additional vehicle lane results in significantly reduced returns and exorbitant costs per user. As we continue to build out our Bus and Bike infrastructure, the same Law will eventually take hold, resulting in decreasing returns for future projects. However, given the vast difference in current capacity and cost per person, the investment required to reach a point where the cost per user equates across different modes (vehicle, bus, and bike) is immense, making these alternatives the clearly superior investment for the foreseeable future.

What are your thoughts on this? Feel free to comment below.

Postscript: Notes on the Assumptions made

To maintain analytical consistency and simplify our model, the following conservative assumptions were made:

  • Cost Scaling: The specific base cost chosen, $2,000 per meter of vehicle lane, is ultimately inconsequential to the conclusion. This is because all alternative costs (bus and bike lanes) are calculated as a fixed proportion (a scalar) of this base figure, derived from the relative size and PPH capacity. Therefore, if the $2,000 figure is proven too high or too low, the cost and capacity ratios that drive this analysis will remain the same. The conclusion about the relative efficiency of each mode holds true regardless of the absolute starting cost.

  • Land Acquisition Costs: We assumed that adding the extra vehicle lane, bus lane, or bike lane did not require the purchase of any additional land. If land acquisition were necessary for the vehicle or bus lanes, those respective costs would increase dramatically, widening the cost differential further. The bike lane, due to its small footprint, is often easier to fit within existing rights-of-way, making this assumption most realistic for that option.

  • Maintenance Costs: We calculated the cost of the bike lane as 43% of the vehicle lane based solely on its comparative size. This intentionally ignores the maintenance variable. Given that it takes over 15,000 bike trips to cause the road damage equivalent to one average vehicle trip, the expected maintenance costs for the bike lane would be significantly lower than 43%. By scaling costs based only on initial build size, we maintained a conservative, and less "skewed," estimate for the alternatives.

  • Alternative Modes: For brevity and focus, this analysis was limited to the most common local congestion solutions (market-based, lane expansion, bus lanes, and bike lanes). Other high-capacity options, such as light rail or sky train systems, were excluded to keep the discussion grounded in the current projects being considered in the region.

Wednesday, 29 November 2023

Nothing is certain but death and taxes - Fiscal Policy part 1

        As we are approaching the municipal budget season with some local governments having already launched their draft budget, and others on the eve of doing so, I felt it would be worthwhile to spend a bit of time to speak about some of the theories around taxation and fiscal policy. To be clear, this is primarily aimed towards economics and public administration students or anyone who may have an interest in public and fiscal policy. I am aiming to educate on many common terms used in fiscal policy, and while I make some comments evaluating policy decisions, these are included as a learning aid to provide context to the discussion.

I Intend, over the coming weeks, to launch a series of blog posts on this topic. However, in this post I want to spend some time exploring the ability to pay, progressive vs flat vs regressive taxation, and tax equity, and then wrap up by looking at how property taxes fit into these definitions.

Ability to Pay

First, we need to define and look at ability to pay. While, here, I will explore the full range of ability to pay, it will be important to recognize that the rest of this conversation focuses only on Income, not ability to pay.

To think about ability to pay we need to define the difference between flow and stock variables and how they relate to income and wealth.

The classic example used is that of a bathtub or a sink. The tap that adds water is the positive flow of water into the tub, while the drain that, drains, water is the negative flow out of the tub. The amount in the tub is the stock of water.

In this same way, we can view an individual’s ability to pay. One’s income is the flow of money in, and one’s expenses are the flow of money out. Beyond this, we also have one’s savings, which is their wealth.


All else equal, if Income is greater than expenses, then one’s wealth is growing, that is the bathtub is filling. If one’s expenses are greater than income, then one’s wealth is shrinking, that is the bathtub is draining. Of course, we have the added complexity with money that one’s wealth is capable of growing or shrinking on its own through appreciation or depreciation or through earning income itself through interest or dividend payments.

While ultimately one’s ability to pay is determined through their total ability to pay from either income or wealth, from a taxation perspective the focus is primarily (and historically) based on one’s ability to pay purely from income. That is, the stock of wealth is predominately ignored, and the focus of the discussion around taxation regimes tends to focus on the flow of income.

Focusing then, just on income, let’s move on to define some commonly used terms that define different taxation structures.

Flat Taxes

                We will begin this by looking at what is arguably the simplest form of taxation, which is a flat tax.

                In this case, everyone pays a constant proportion of their income in taxation, say 10%.  Thus, whether you earn $10,000 or $50,000 or $100,000 a year all will pay 10% of their income in taxes. Of important note, while all three of these listed incomes pay the same proportion, the amount of taxes they pay is clearly increasing. This can be seen in the table below:

Progressive Taxes

Progressive taxation is a case where higher income earners pay higher proportions of their income in taxation.

It is difficult to have a conversation around progressive taxation if one does not fully comprehend the notion of a marginal tax rate. As a discussion of marginal tax rates would be a post on its own, I would recommend that anyone who does not fully understand marginal tax rates take a moment and look this up to obtain a cursory understanding.

If we were to continue to utilize the same incomes as introduced above, under a progressive taxation system we might expect each of the above income earners to pay an average marginal tax rate of 0%, 10%, and 20% respectively.

That is the lowest income earner may not even pay taxes, and as one’s income increases, so does the proportion of the tax that they pay. The amount of taxes paid under the above-imagined progressive system can be visualized in the table below:

Regressive Taxes

                Finally, let’s explore a regressive taxation scheme. A regressive scheme is really just the opposite of a progressive one. That is in this scenario an individual would pay a lower proportion of their income towards taxation as their income rises. An example of this would be a scenario such that as one’s income rises; they are capable of hiring a tax professional which allows them to take advantage of tax loopholes to lower their overall rate of taxation. The result of such a taxation scheme can be visualized in the table below:

                It is important to note that the value of the taxation, in this case, is still increasing as income increases. Those earning $100,000 are still paying more in taxes than a person earning $10,000. However, the proportion of their income that is going towards taxes is shrinking. That is, the value of the tax payment does not need to be decreasing for a system to be regressive.  

Tax Equity

                Above we introduced three different taxation regimes, flat, progressive and regressive with respect to income. Next, in this section, we will introduce two ideals, which when utilized, help create a taxation system that is typically understood to be fair and just. These are the ideals of vertical and horizontal equity.

Vertical Equity

                Vertical equity is actually the foundation for a progressive taxation structure. A taxation system would have greater levels of vertical equity if those with greater ability, pay a higher proportion of their income towards taxation. While this might be intuitively believed by some, it is of course challenged by others. So, let’s take a moment and look at a few arguments as to why a taxation system that is preferred from an equity viewpoint.

            Maslow’s Hierarchy of Needs

While I have not found any actual reference to this. The concept of vertical equity was explained to me years ago along the lines of Maslow’s Hierarchy of needs.

We have as our base physiological needs such as water, food, shelter, and clothing. If our income is such that we can only provide these needs for ourselves we have very little if any capacity to support society through taxation. Thus, the idea is that at these income levels, you ideally would not be subject to taxation. Without getting into the policy discussion of whether or not this is an adequate amount, this is the rationale that your first $15,000 (approx.) of income is tax-free – this provides one with the ability to meet their own base needs before they start paying into services that help meet collective needs.

As we move up Maslow’s Hierarchy to the next zone which covers safety needs such as security, employment, and health we are now at a zone where the necessities of life (food, shelter, warmth) have been covered, and we are now able to begin investing in our safety and well-being. Many of these needs can be best met through public provision through legislation, policing, laws, and our legal system. Thus, the belief is that since your base needs are met, and some of the next level of needs can be considered public goods, they can be provided through a tax and re-distribution system. Thus, if your income rises such that you can begin to concern yourself with this level, you ought to begin paying a proportion of your income to the government to provide these services.

As one receives higher and higher incomes that allow them to devote a smaller proportion of this income to these basic physiological needs, they have a greater ability (although not necessarily willingness) to pay into taxation to provide a greater provision to society as a whole.

Along these lines, it has been justified to have low-income earners pay a small percentage of their total income towards taxation, and when income increases the proportion, they pay in taxation would also increase through the marginal tax rate.

Marginal Propensity to Consume

                The other basis for vertical equity is based on the notion of the marginal propensity to consume (MPC). While a mouth full, the marginal propensity to consume is a measure of how much extra money you will spend on consumption for an extra dollar earned.

                For example, if you receive an extra dollar in income and spend 80 cents on consumption (thus saving the other 20 cents) it would be said that you have a marginal propensity to consume of 0.80.

It is typically found that the marginal propensity to consume is not constant with income. In many ways, this supports the previous conversation around Maslow’s Hierarchy of needs. It is often found that at the lower ends of the income spectrum, households will have a marginal propensity to consume close to, if not equal to 1.00. This means, that for every extra dollar of income earned, they will spend this entire dollar on consumption. Having been in this state for many years, I can attest that every dollar has immense value as it provides extra goods and services which are utilized to meet one’s base physiological needs of food, clothing and shelter.

However, as one’s income begins to increase, we find that one’s marginal propensity to consume begins to decrease. That is, as one has access to more income, they can cover their base physiological needs, and then have leftover income which they are then able to save or invest to meet future or other needs.

Robert Reich in his Netflix documentary “Saving Capitalism” makes the analogy that a person only needs so many pairs of pants, food, shelter, etc. At lower levels of income, all your resources are going toward obtaining these basic necessities. As your income rises you may begin to buy more pants, food, shelter, etc. but at some point, you don’t need another pair of pants, or another cup of coffee, thus your consumption slows, and this extra income is moved into savings instead.

Based off of both of these theories, it would be largely unethical to place a tax burden on those with low incomes as they may be already struggling to meet their base physiological needs which can be evidenced by the higher marginal propensity to consume. However, as one’s income increases, their ability to pay also increases and thus one ought to increase their contribution to society through taxation.

Of important note – hardly ever does an increased ability to pay translate to a higher willingness to pay

Further supporting the notion that vertical equity is preferred in taxation structures is the common desire for a level of income equality, or more specifically, a low level of income inequality. Thomas Piketty is one the world's leading economists exploring the role of income inequality and some of its causes. One of Piketty’s more surprising discoveries is that taxation systems that are more progressive result in more equal incomes before taxation.

This is surprising, as it was often understood that a highly progressive taxation structure results in greater income equality after tax, because the rich are taxed more, with some of this tax being re-distributed to the bottom. While this is true, the discovery was that highly progressive taxation structures also result in more equal income distributions before the taxes are even collected.

I won’t get further into the weeds on this, other than to say that there is plenty of work done showing the importance of income equality in promoting social cohesion and stability. Thus, for all the reasons mentioned above, it is often accepted that a progressive taxation system that holds to notions of vertical equity is a desired state for a fair and just tax system. The area of controversy or argument is around how progressive such a system should be.

Horizontal Equity

                I won’t take nearly as long to go through this term as it is by far less controversial and much better understood.

                The notion of horizontal equity is that those who earn the same income should pay about the same in taxes. That is all households with an income of $50,000 should pay about the same amount of taxes for a given system to be fair and just.

Property Taxes

                Let’s then attempt to overlay the above discussion about fair and just taxation to property taxes. To briefly summarize to start us off, it is argued that a fair and just system of taxation is a system that appeals to notions of both vertical and horizontal equity, that is, a system which is progressive as incomes rise, and relatively constant across similar incomes.

                Property taxes however are not an income tax, but closer to a wealth tax. This is because you are taxed based on the value of your real estate. The rate at which the value of your real estate is taxed is a flat rate. That is if we suppose a given municipality had a tax rate of 2%, all property would have to pay 2% of its value in taxation irrespective of if the property was worth $100,000 or $500,000 or a million dollars. This can be seen in the table below:

Note, in reality, property tax rates are typically less than a half percent of the property’s value, for example in Langford BC the Municipal tax rate was $2.08835 per $1000 of value, or 0.2088%).

                Now – to determine if these property tax rates have a level of vertical equity, we need to attempt to transition this tax rate from being taxed based on wealth to being taxed based on income. To do so we must assume that higher incomes can purchase higher-valued homes. If we make a simplifying assumption that the maximum qualified amount is a payment equal to a third of one’s income we get the following incomes, and then the following property tax/income rates:

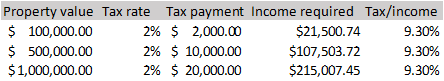
                What we witness is that based on this assumption a flat rate across property values translates to a flat rate to our incomes.

                However, it would similarly not be a stretch to presume that those at lower income levels may be forced to ‘max out’ their qualification limits to be able to afford shelter, while those at higher income levels may choose to devote a lower proportion of their income towards their shelter. The result of this would cause a property taxation regime to skew towards being regressive as can be seen below:

Note: the assumption is that each income category devotes 33% (1/3), 25% (1/4), and 20% (1/5) of their income to shelter respectively

Thus, our takeaway from this is that, at best, a property tax scheme is a flat tax rate, and at worst is regressive. Most likely we are more in the regressive realm than the flat realm. That is, property tax likely fails at being a fair and just taxation structure as it fails to achieve vertical equity.

Can we try to make property taxes more equitable?

                If property taxes are by default likely a regressive form of taxation, there is a natural question that arises.

I)                    Can municipalities change their taxation structure to make this system more progressive?

There are a few answers to this. The simple answer is ‘no’. As municipalities are not a level of government defined in the constitution, they have no prescribed authority to collect taxes beyond the authorities given to them by the provinces. That is, their ability to raise funds through taxation is strictly dictated to them by the province. As such, municipalities can change the rate of taxation but have very little flexibility beyond that.

This however doesn’t mean there is nothing that can be done to promote a more progressive system. It just means that policymakers need to be a bit more creative, looking at all the social outcomes, not just the tax incidence.

For example, municipalities do collect revenue through other sources such as user fees and developer amenity contributions. Focusing for example on amenity contributions, these funds could be utilized in one of two ways:

I)                    Provide new community amenities such as green space, parks, community centers, or public services.

II)                  Re-direct these funds back to the taxpayer in the form of a transfer.

         Now in many ways, the economist in me sees tremendous value in option (II). After all individuals have a much better understanding of where a dollar should be spent to give them the best benefit. Unfortunately, given the nature of the municipal tax and transfer system, a transfer back to the taxpayer by cutting tax rates (say we cut by 100bps from 2% to 1%) will disproportionately benefit the taxpayers with the highest value homes, thus doing nothing to promote vertical equity as can be seen in the table below:

                Option (I) on the other hand provides parks, green spaces and public spaces that can be utilized by everyone. Here is the crux. While everyone benefits from these community spaces being provided, those at the middle to lower end of the income spectrum tend to benefit disproportionately from such services.

                Why?

                One of the biggest arguments put forward as to why this is the case is that higher value real estate often includes larger yards, which can be thought of as a private park, or private piece of green space, while lower value real estate typically has less of a yard if any.

                Thus, while the public provision of parks and greenspace does positively affect everyone, those without private yards (lower-valued real estate) are the ones who tend to benefit disproportionately from such policies.

                That is, by engaging in option (II) one is in many ways adding insult to injury, as by doing so the policymaker is choosing to disproportionately subsidize those who already have highly valued real estate and typically have access to private green space while simultaneously not providing public green space for the rest of the residents.

                Thus, while option (I) will not necessarily result in lower taxes, and may not necessarily result in a move towards vertical equity, it does have the potential to increase social welfare by allowing for a more fair and equitable provision of public amenities which may greatly increase the welfare of those who are already paying a higher proportion of their incomes in property taxes.  

Summary

                Throughout this post we have introduced the basis of ability to pay, differentiating between income and wealth. From here we moved on to evaluate flat, progressive and regressive taxation structures before moving on to look at the notions of vertical and horizontal equity in an attempt to define a fair and just taxation structure. We then saw that property taxes fail to achieve vertical equity, and are in fact typically regressive in nature. Based on this a brief thought experiment was explored to evaluate whether or not property taxes could be made more progressive, or at the very least, be utilized in such a way as to improve social benefit.

Continuing on this theme the next post will be on the topic of the high cost of low taxes followed by a discussion on user fees, pay-for-access services, and their potential role in the provision of public goods and services as well as the role they play in tilting the total taxation system more toward a progressive or regressive one.

If you have any thoughts or comments, please feel free to comment below. 

The Langford Budget: There are No Solutions, Only Trade-offs

  Image Generated with Google Gemini I don’t often shift to this perspective on this blog, but today I am putting on my hat as a Langford Ci...